I’ll start with holding my hands up and saying I got it wrong – last month I wrote that I couldn’t see any chance of a Brexit. Being wrong is a rare occurrence for me so savour the moment…
Lets deal with the headline numbers before addressing the elephant in the room. Average 360 asking prices have increased an incredible 5.29% over the last month. The index stands at 172.21.

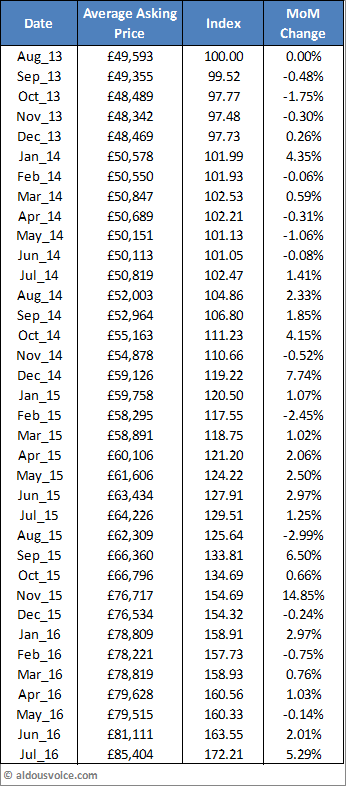
This increase in prices has been solely driven by the, frankly ludicrously priced, spider with 82 miles. Either the price is a typo or the vendor is living in cloud cuckoo land, I just can’t see anyone paying this sort of money for a 360. I should add that I said the same about the Hexagon cars and look what happened to them…
The information that I’ve been receiving has been pointing towards the market peaking and this was well before the referendum. Specialist dealers are becoming wary of holding stock so their bid-offer spread has widened (to take into account of any price falls that may occur whilst the car is on the forecourt). Non-specialist dealers are paying strong money for less than perfect cars (both 360 and F430). For me these two things could signal the peak is near – those that know the market are pulling back whilst those who don’t are jumping in with both feet.
A note on Brexit: My opinion is that this will apply pressure to values in the near term. One of the factors that has driven the upwards rise in the market has been the interest in cars as an alternative investment. In times of uncertainty most cash takes a flight to quality and certainty. This alone will dampen demand. If the UK does start to slow down then those people who have “invested” in a Ferrari may wish/need to exit their purchase and could need to discount their asking price to do so. You only need to look at Porsche 991 GT3 RS prices to see what one or two “cheap” cars can do to the overall market.
Here’s the big table:

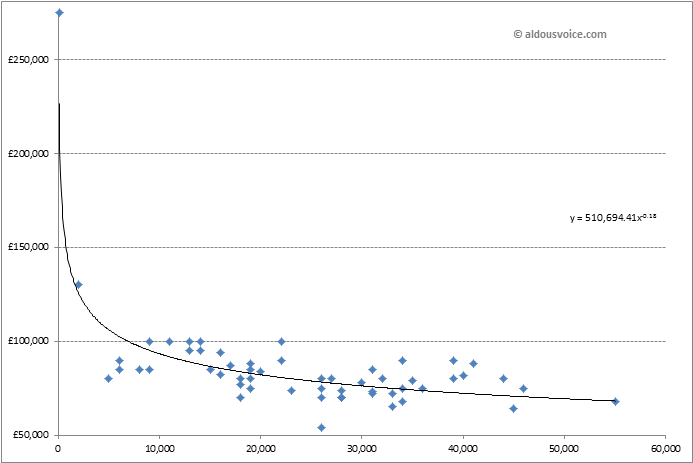
Price vs mileage:

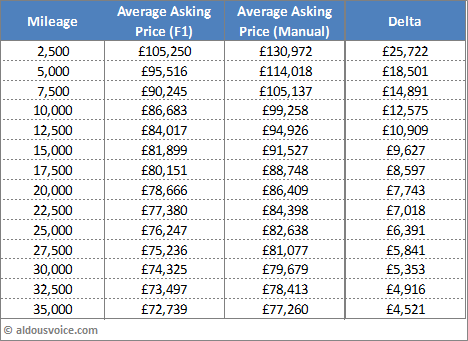
F1 vs Manual. The chart is a little messy due to the £275k outlier…

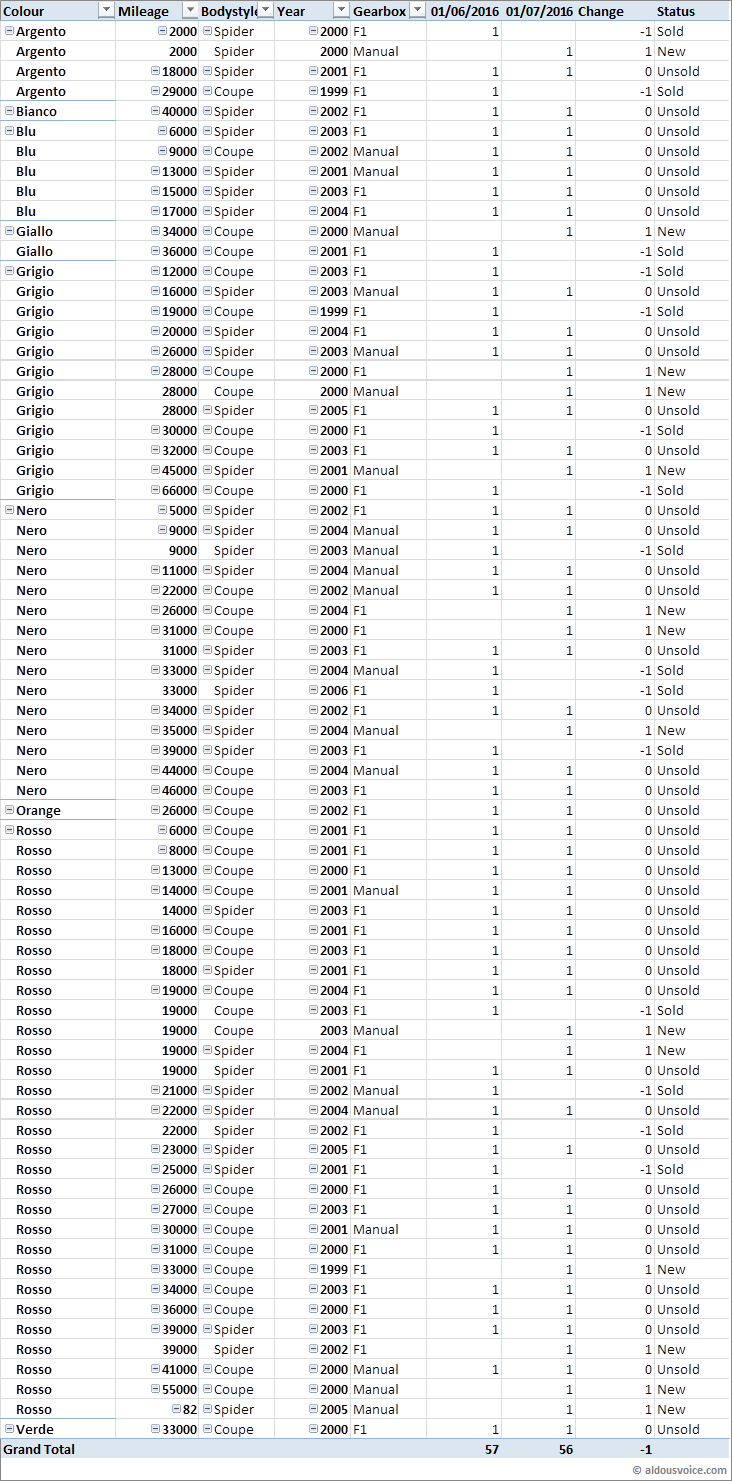
Here’s the table showing which cars are in/out of the data population.
That’s it for this month – please do get in touch if you think I can assist with anything.
Related posts:
- Ferrari 360 & F430 UK Production Numbers
- Ferrari 360 & F430 UK Export Numbers
- Ferrari 360 & F430 Buying Guide
- Ferrari 360 Buying Advice
- Ferrari 360: A Dealers Perspective
Other posts in this category: Buying and Selling
Pistonheads price threads:
If you enjoyed this post why not subscribe to this blog for further updates? Simply enter your email address in the box at the bottom of this page. Your details will not be shared.

Aldous,
I think from this point forward this might get very interesting……Thanks for keeping it running…
Aldous,
I have performed all of the necessary maintenance (tires, brakes, fuel pumps, ball joints, top service, clutch replacement, exhaust, pump relay, etc.) on my 2002 360 Spider. I now have 19,000 miles. I love the car, but I am wondering whether you have some thoughts on the 430 as to appreciation, value, etc. I know there were a lot more of them made, and their styling is a little different. They have various improvements. I am concerned about putting many more miles on the 360 which will devalue the car, so the thought occurs to me to consider upgrading. The belt service is once again nearing, so that is another cost. What are your general thoughts on the subject? Is it worth the additional 40K or so to get into the 430 over the 360? Am I worrying too much about the mileage on the 360?
Thanks, Dave F.
Hi Dave,
I personally think that the F430 is a worthy upgrade – I have written about it on this site somewhere if you search for the article.
In terms of numbers, certainly in the uk there are broadly the same number of 360 as F430. I have a thread running on Pistonheads if you want to know about uk values.
Thanks,
Aldous
Aldous great work and many thanks. The 82 miler should trade at a premium BUT!!!
How are you calculating your averages? I’m wondering why your outlier is appearing & maybe using median rather than mean would be best for this data set.
Arithmetic average
Arithmetic average is the mean. Median is a much better of average than mean when datasets include exceptionally high and/or low values. Their impact is minimised. I think plugging the median into your tables will knock out most of the silly asking prices & low miler museum pieces.